A team of epidemiologists, mathematical modellers and economists at Oxford University has released an independent analysis of the trends in the number of coronavirus infections (incidence) on the Isle of Wight, UK before and during the first phase of the test and trace programme (TT), including the first version of the NHS contact tracing app. Results of the study, which has not yet been subject to formal peer review, can be explored on EpiNow interactive tool.
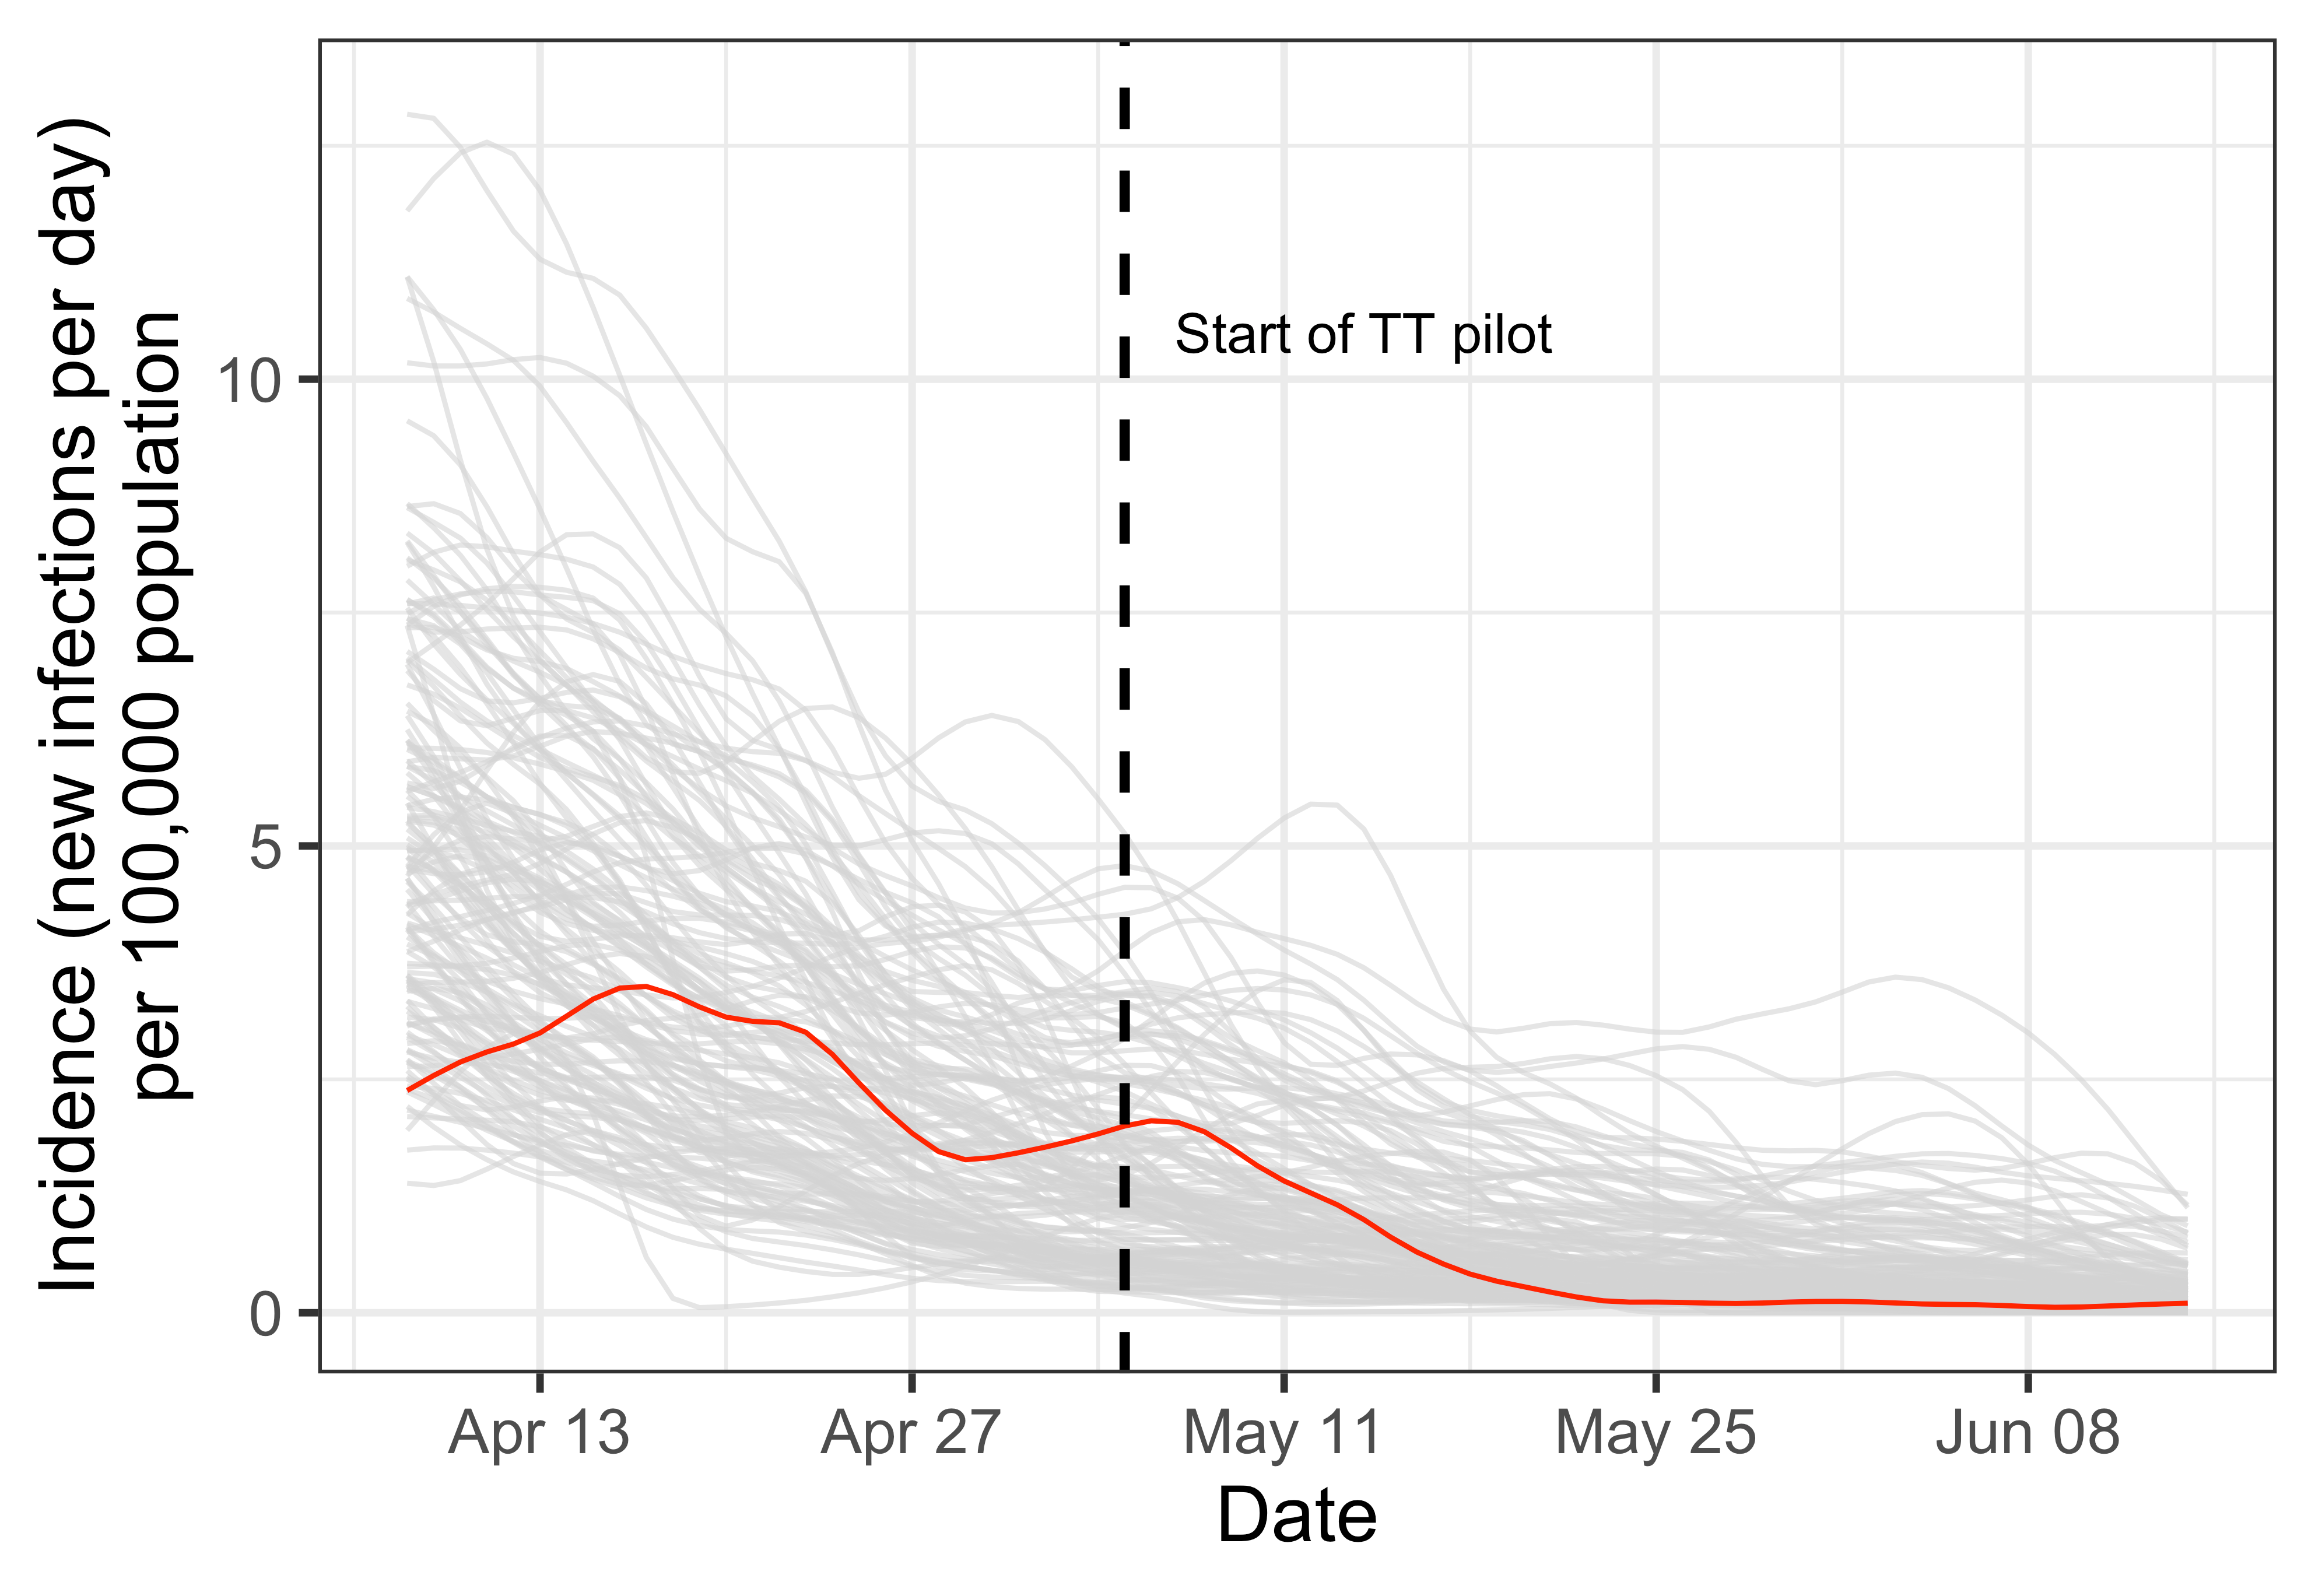
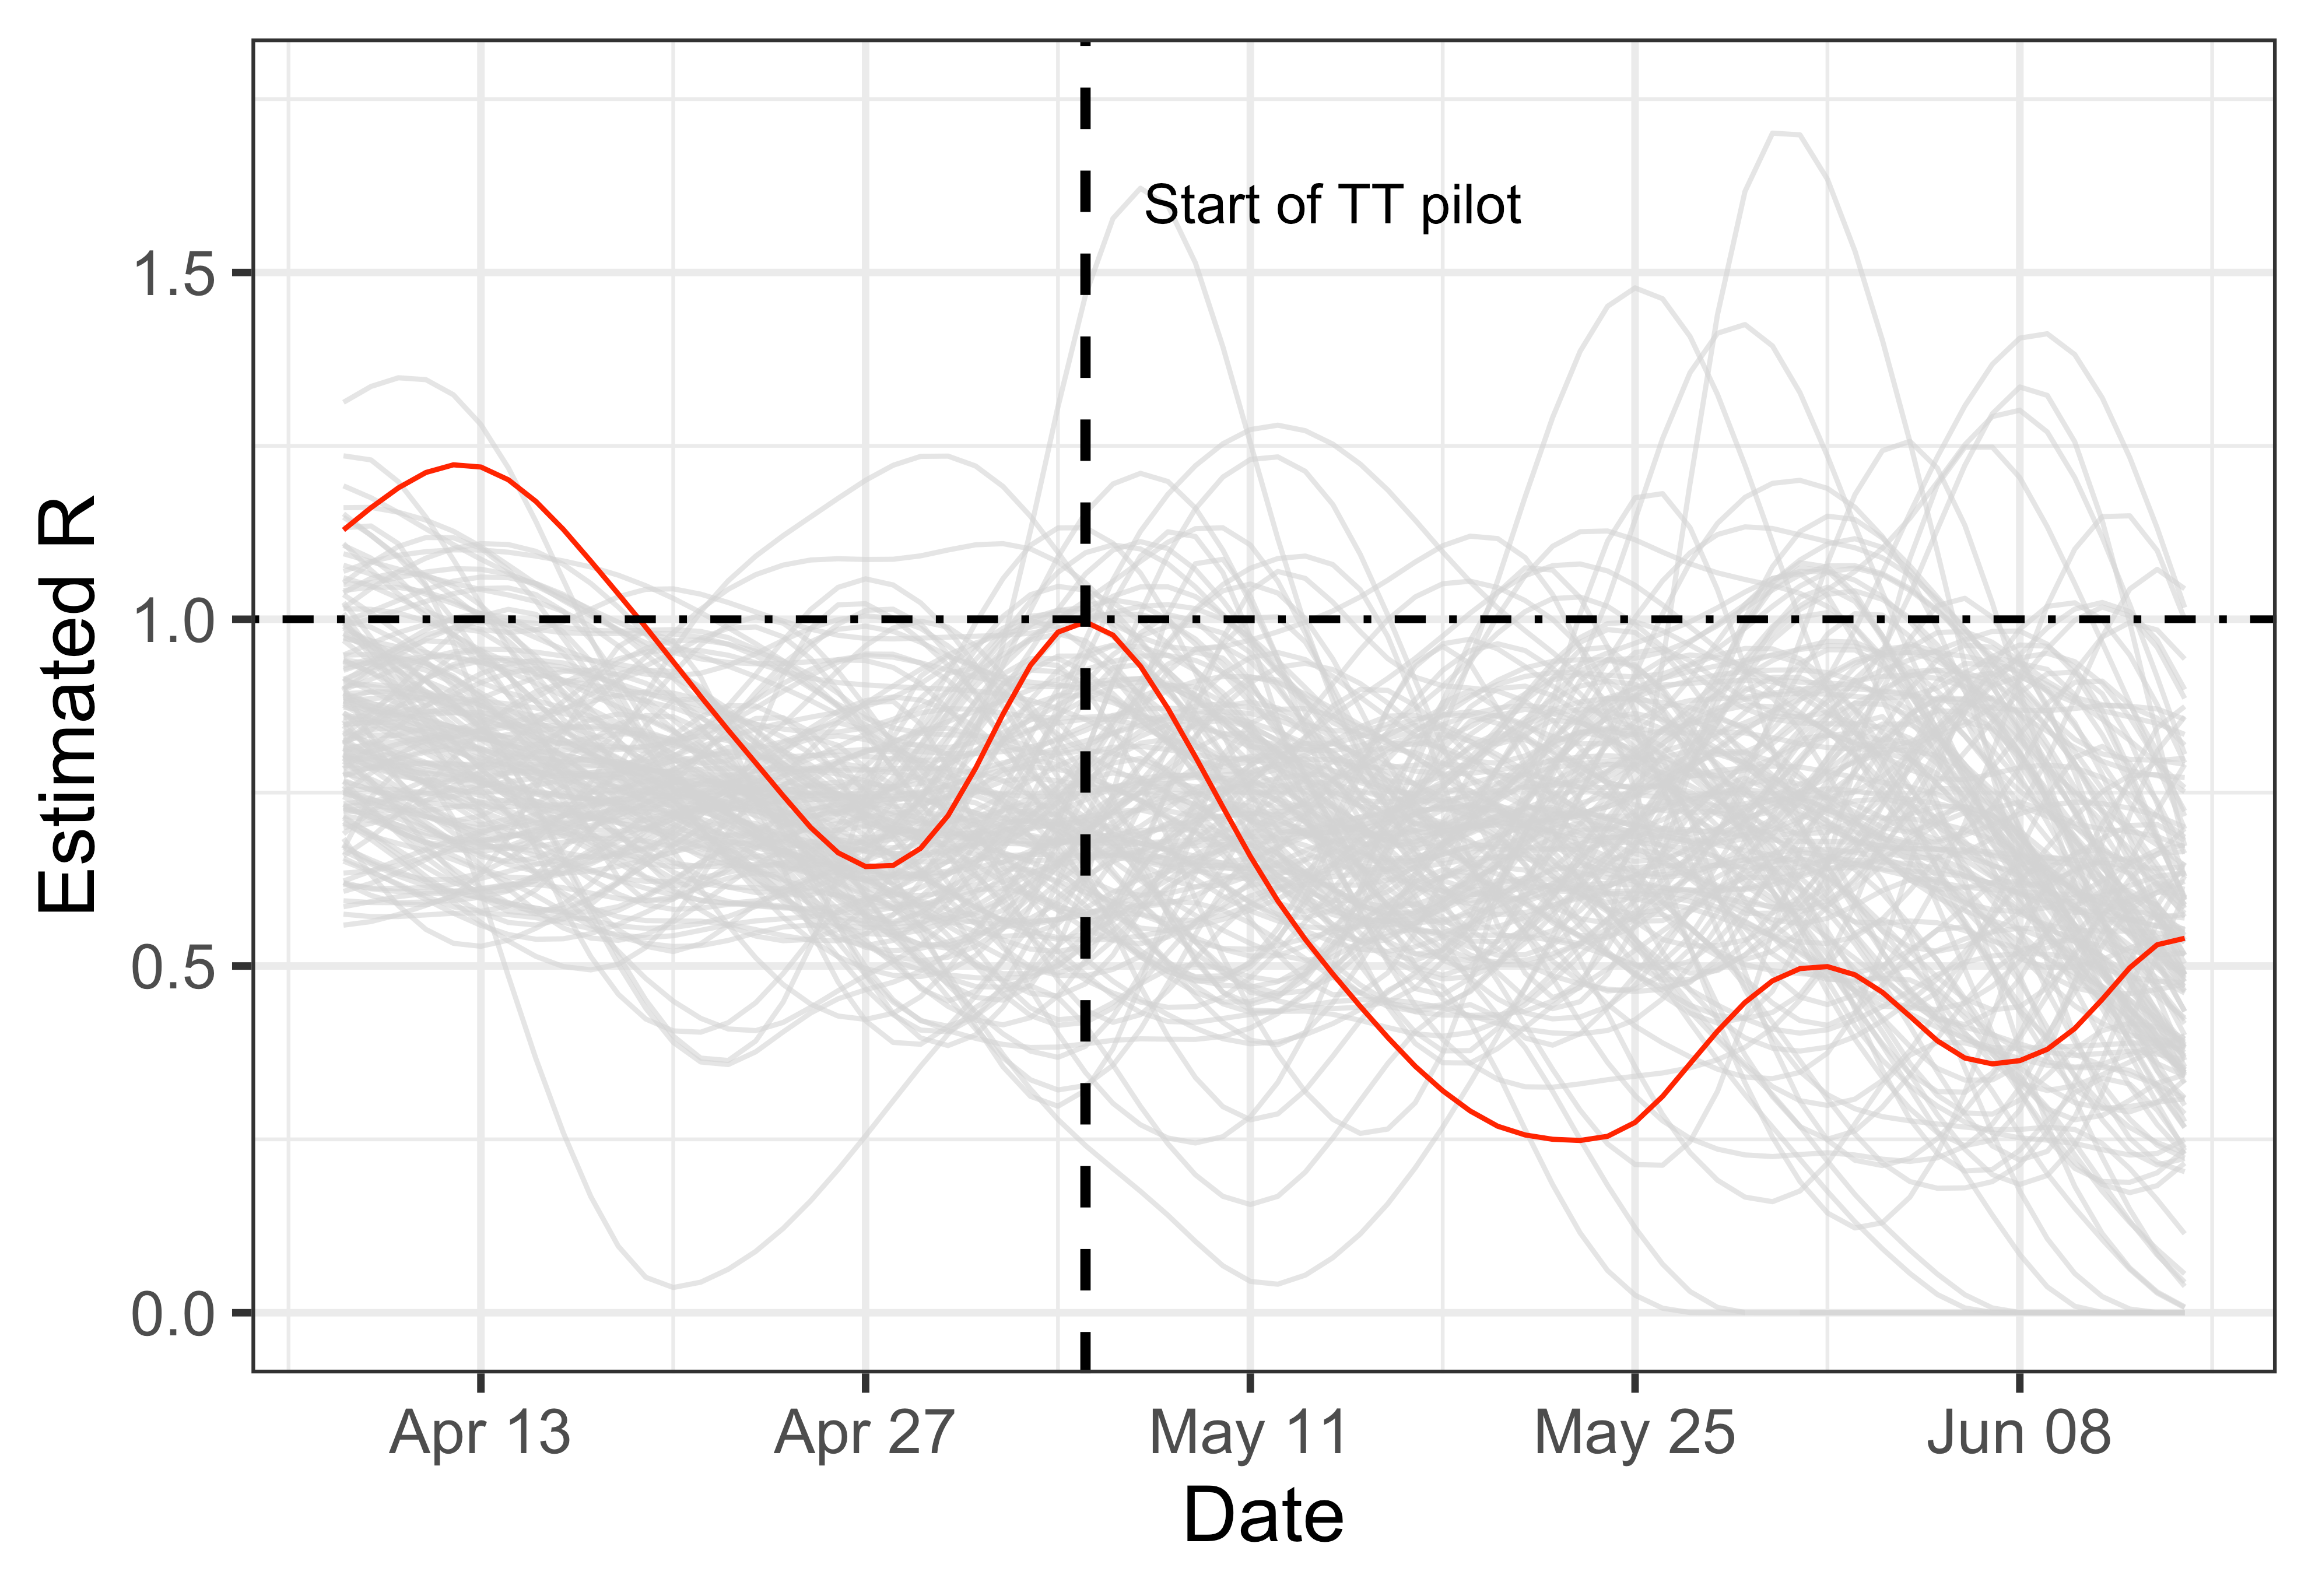
The results show rapidly declining total incidence, per capita incidence and reproduction number (R) levels in hospital and community tested cases on the Isle of Wight following the introduction of the TT programme on May 5, 2020. The Isle of Wight results also show a decreased R value when compared to other areas of the UK, positioned with one of the worst rates (147th out of 150 upper tier local authorities - ULTA's) just before the TT programme, and rising to one of the best R rated areas (10th out of 150) by the end of the analysis period.
In order to accurately compare data from the Isle of Wight with 149 other local authorities in the UK, the research team estimated incidence and R based on Pillar 1 reported coronavirus cases from patients, health and care workers tested in hospital laboratories. In April, the Isle of Wight was amongst the worst affected regions; following the introduction of the TT programme in May we see both incidence and R rapidly decline in hospitals. By mid-June the epidemic is under control with an estimated reproduction number of around 0.5 (upper estimate 0.75), and an average of less than 1 new hospital-based infection per week from late May to mid June. Comparing the results with Pillar 2 community testing data for the UK, except Wales, confirms the same positive trends with estimates valuing the reproduction number on the Isle of Wight 20-25% lower than the national level during May and June.
Professor Christophe Fraser, lead author and Group Leader in Pathogen Dynamics at Oxford University explains, ‘Our analysis estimates rapidly declining incidence and R rates on the island after test and trace is introduced. The results are equally encouraging when we compare the island’s epidemic growth rate to 149 other regions in the UK. The island shifts from amongst the worst R levels in mid-April to regain epidemic control around within a month of the test and trace programme starting.”
Dr Michelle Kendall, first author on the report from Oxford University’s Nuffield Department of Medicine explains, “The epidemic on the Isle of Wight rapidly declined following the introduction of the test, trace and isolate programme. It’s hard to disentangle the exact causes of the island’s success without a more detailed breakdown of data, but we’re hopeful that as more test and trace data becomes available we’ll be able to determine which individual interventions had the greatest impact. The research method we have developed could also be adapted to identify hotspot areas where a surge in cases requires further investigation. ”
To validate the results the Oxford team created a synthetic control - a model region based on combined data from other English areas (UTLAs) which more closely resembles the Isle of Wight with regard to initial R, age distribution and ethnicity. The comparison shows that the epidemic on the Isle of Wight improved significantly faster than would have been expected in the absence of the TT program, with R as low as 0.25 in mid-May when R in a comparable region would be expected to be around 0.75.
Professor Christophe Fraser concludes, “We see a consistent picture of declining Covid-19 infections and reproduction rate on the Isle of Wight following the introduction of the test and trace programme. With more data, including detailed testing and app contact tracing pilot results, we could provide a clearer assessment of the impact of individual infection control measures, deepen our assessment of geographic differences, and provide further evidence to inform regional or localised outbreak responses.”
 incidence of new infections per capita
incidence of new infections per capita
 estimated R for each UTLA area
estimated R for each UTLA area
Figure 3B (left) shows back calculated incidence of new infections per capita for each UTLA area in grey, with the Isle of Wight in red. The dotted line shows the start of the TT programme on May 5.
Figure 4B (right) shows estimated R for each UTLA area in grey, with the Isle of Wight in red.


